
10-Part Complete akYtec Industrial Automation Masterclass
This practical tutorial is part of an interconnected, step-by-step course designed to transition hobbyists and makers into professional B2B Industrial Integrators. Every lesson builds directly upon the hardware configurations, safety calculations, and visual programming rules established in the earlier sessions.
A critical phase when stepping away from maker-grade microcontrollers and moving toward industrial-grade automation is understanding human-machine visualization. Beginners frequently confuse the integrated display panel found on the akYtec PR200 with an advanced, full-graphic Human-Machine Interface (HMI) panel. To be technically precise, the PR200 does not house an HMI. Instead, it is equipped with a rugged, built-in monochrome, 2-line alphanumeric text LCD display.
This built-in screen provides two independent rendering fields, with each row limited to a fixed maximum length of 16 alphanumeric characters. While you cannot draw complex graphical shapes or high-resolution operational vector dashboards on this display, its massive engineering advantage lies in its absolute native integration. Unlike standard Arduino projects where your processing loop crawls while wrestling with external I2C device addresses, third-party libraries, and unstable jumper wire lines, the PR200 LCD driver engine maps directly into your primary akYtec Logic Programming (ALP) workspace variables without adding communication latency.
In this module, we will learn how to interface our core visual logic loops directly with the display controller. We will configure a live status row that automatically monitors, translates, and renders text notifications based entirely on the state changes of our physical internal memory blocks.
🎨 Step 1: Navigating the Hidden Display Manager & Customizing Forms
To alter what text renders onto the physical module faceplate, you must leave the standard logic grid sheet and access the specialized interface workspace:
- Look at the vertical dock positioned on the far-left edge of your screen. Locate the tab labeled Display Manager. Hovering your mouse cursor over this vertical strip acts as a trigger: an animated sidebar window will instantly slide open out to the right. Moving your cursor away from this pop-out panel allows it to automatically slide back and hide into the left dock space to preserve your workspace grid.
- Inside this sliding tree hierarchy panel, you will see your project’s active display forms. By default,
every new project initializes with a single pre-built asset named “Form 1” structured under
Groups ➔ Group 1 ➔ Form 1. - Positioned directly beneath the structural tracking tree is the Parameters sub-window. Highlighting an individual form inside your tree updates this box contextually, allowing you to edit the form’s Name, write a custom Description, or toggle the Visibility properties. If your application profile relies on multiple screens, renaming your forms to give them clear names simplifies your navigation tree. To begin editing, double-click directly over your targeted form line item to open its visual layout canvas inside a new central tab.
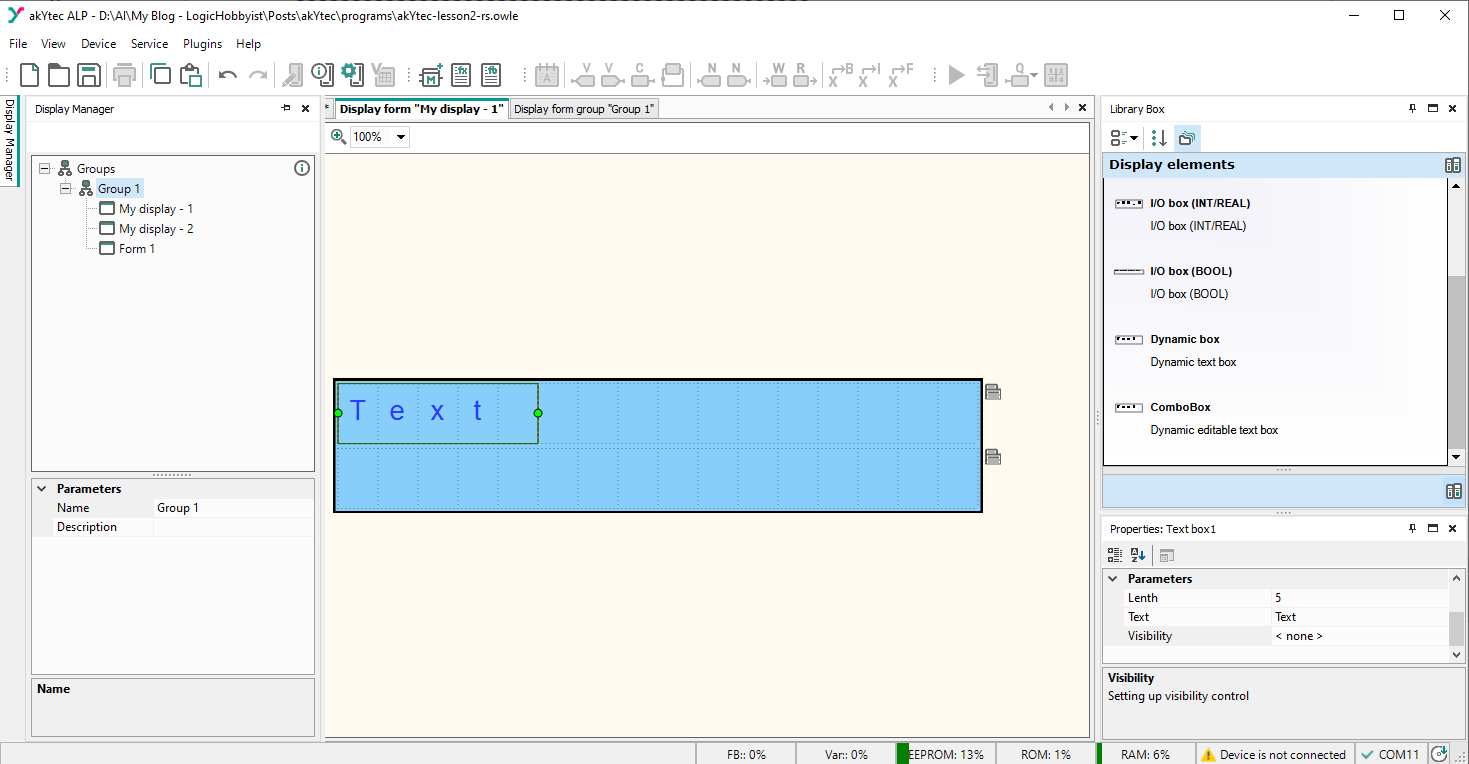
Figure : 1 Customizing screen hierarchies inside the left-hand Display Manager tree view, demonstrating multiple named forms configured under an organized group container.
🧩 Advanced Layout Tip: Splitting the Canvas Window View
When programming complex workflows, you frequently need to check your main logic program variables while simultaneously editing your display screen configurations. Opening and closing tabs constantly wastes critical time.
The Split-Screen Trick: Left-click and hold your mouse button down over your active display form
tab header (such as Display form "My display – 1"). Drag the tab window pane outward toward the
center of your screen. The ALP editor will instantly populate visual divider orientation arrows
on your screen layout. Drag and snap your cursor block onto one of these layout arrows to pin your screens
side-by-side, allowing you to trace your visual FBD logic and your LCD interface layouts on a single shared
screen.
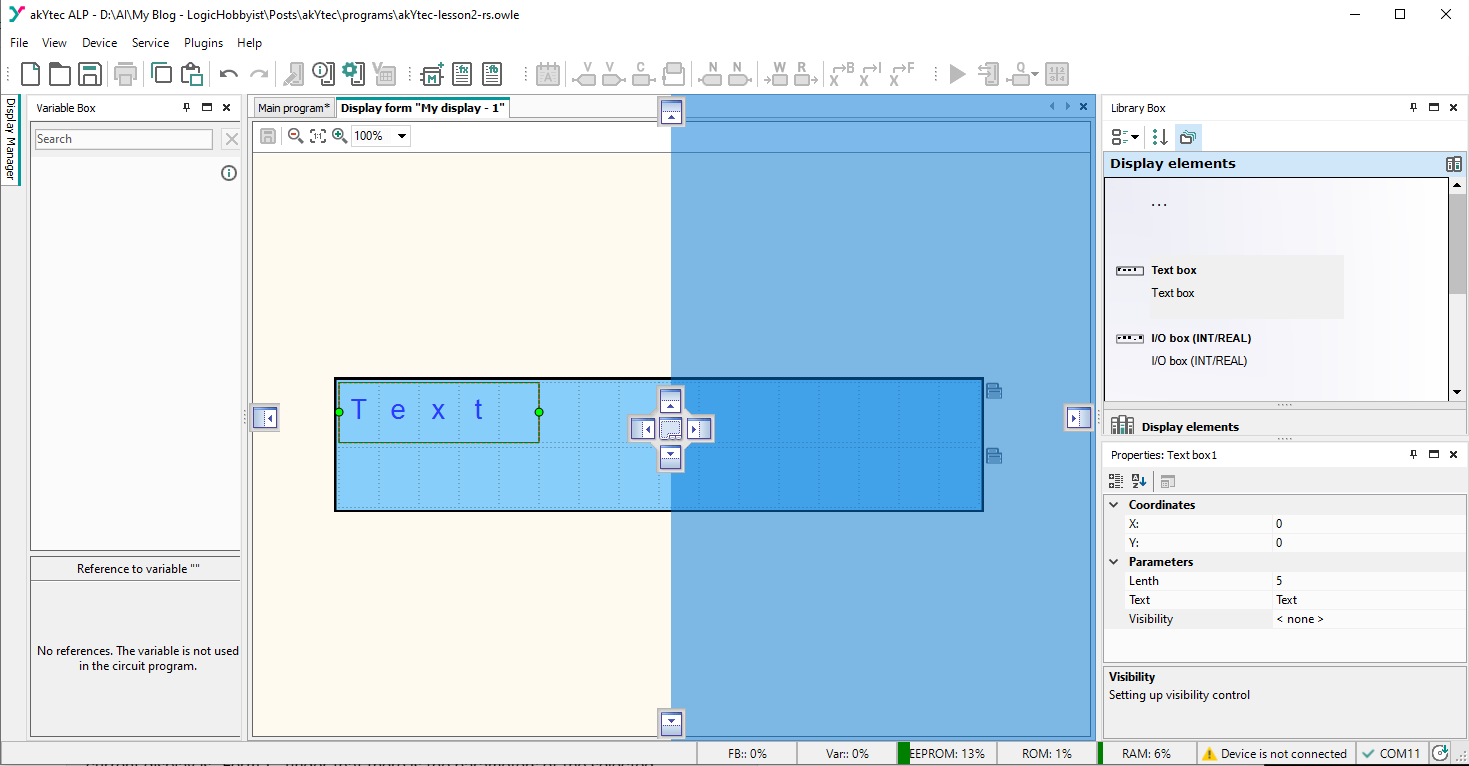
Figure : 2 Dividing the central canvas window pane to trace primary function block program sheets alongside active screen layouts simultaneously.
📦 Understanding the Right-Side Library Box & Properties Docks
Unlike your primary logic program environment which references an extensive inventory of diverse logic operators, registers, and macro components, the LCD form layout environment is focused and streamlined:
- The Right Library Box: All available user interface objects are consolidated under a single parent directory folder named Display Elements. Double-clicking this folder category expands your inventory panel to show the 4 fundamental elements that the PR200 screen controller can process (including numeric boxes, boolean states, and text fields).
- The Bottom Properties Panel: Directly underneath the component box sits the third crucial layout zone. This properties dashboard changes its parameters contextually depending on what specific element is currently highlighted on your active screen grid. Here, you can configure crucial hardware properties such as element character length metrics, variable data types, text input strings, and visibility parameters.
⚙️ Step 2: Mapping Internal Variables and Advanced Control Logic
To bridge your physical I/O with the LCD screen—and introduce soft-key controls that bypass physical buttons—you must establish a clean variable mapping layer in your FBD logic program sheet:
- Placing the Data Blocks: Locate the upper workspace shortcut toolbar menu. Click the Variable Output Block icon once, then click on the empty canvas grid area where you want to anchor the node. Repeat this exact placement sequence 3 times. Next, click the companion Variable Input Block icon from the top bar and position it on the canvas sheet as shown in the layout diagram template.
- Adding Parallel Control Gates: Drag and drop a standard OR logic gate
element from your right library box pane into the workspace. Interconnect your terminal paths cleanly: link
the output blocks sequentially to physical input
I1, inputI2, and the output path of your OR gate. Wire your new variable input block straight into the primary input pin terminal of that OR gate to form a parallel programmatic override channel. - Defining the Software Variables: Double-click over any newly placed block node to initialize the variables definition editor table window. Double-click the input slot row directly inside the Variable Name column header area (where it reads “none”) and specify your first label identifier tag. Press Enter to sequentially configure the next rows. By default, the software configures these entries as a BOOL (Boolean 0/1) data type; leave this configuration setting at its native default parameter. Before closing the manager view, link your current canvas block node precisely with its matching tag name assignment, then click OK.
- Tying the Circuit Nodes: Double-click each remaining unlinked variable block on your canvas workspace one by one. Select its corresponding registered tag entry from the system lookup matrix array list to ensure all 4 internal software registers map flawlessly to your FBD logic sheet.
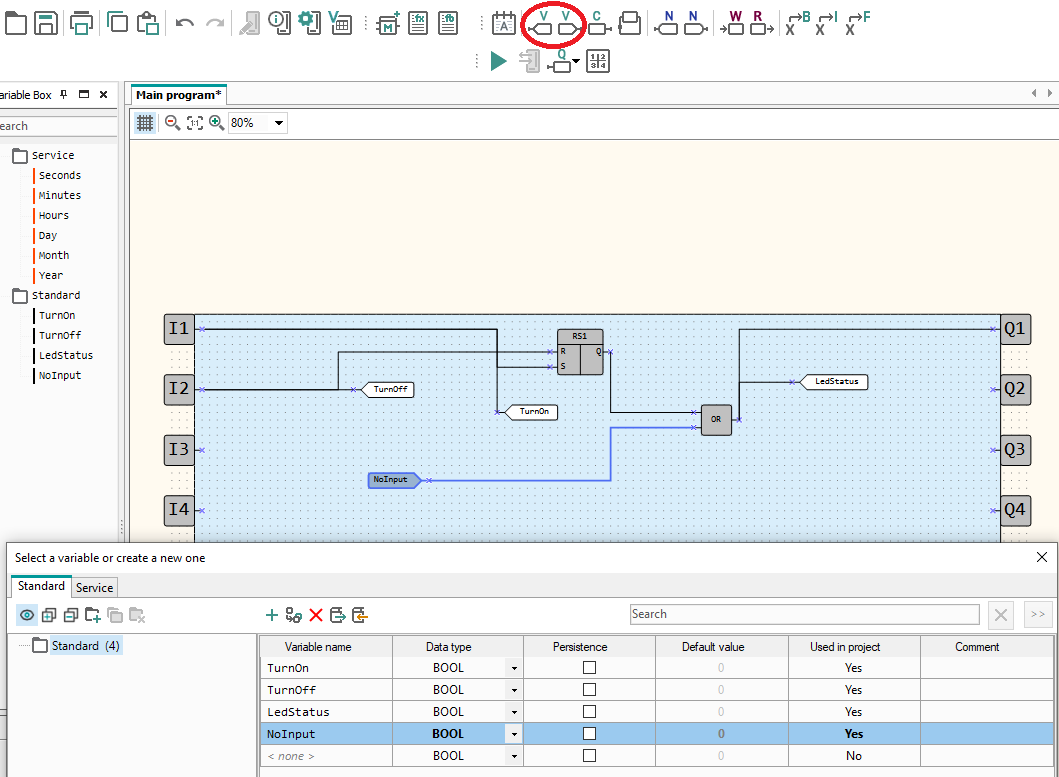
Figure : 3 Arranging variable input and output blocks alongside parallel OR gate override logic nodes within the primary FBD canvas screen.
📐 Step 3: Designing the LCD Text Grid Matrix Layout
With the logic parameters completely defined, we now navigate back onto our visual display layout sheet to format the character strings for our 16×2 screen grid:
- Opening the Target Layout Form: Left-click directly onto your pinned display canvas form tab on the right section (if your workspace window tab layout isn’t loaded on your screen, review the instructions mapped in Step 1).
- Configuring Field 1 (Input I1 Monitor – Top Left): Double-click the Display
Elements folder inside the right library dock panel. Drag an I/O Box (BOOL)
object and drop it straight into the extreme top-left corner index block of your 2-line layout grid. In the
lower properties panel, adjust its Length metric property to 4 digits, then
configure the parameters exactly as follows:
• Link the field block directly to your registeredTurnOnvariable tag.
• Set the Text for ‘True’ string field to 1 and the Text for ‘False’ string field to 0.
• Set the Text Before label string parameter to exactly"ON "(include a trailing space inside the quotes to keep a clean separator gap).
• Modify the Editable parameter toggle choice line to read No to lock the hardware channel. - Configuring Field 2 (Input I2 Monitor – Top Right): Drag another I/O Box (BOOL) onto the
top line, positioning it toward the right side. Set its character Length metric field to
5 slots, and configure its properties dashboard parameter lines:
• Link the target path directly to your registeredTurnOffvariable tag.
• Set the True Text to 1 and the False Text to 0.
• Set the Text Before label string field to exactly"OFF "(ensuring a trailing space is added inside the quotes).
• Set the Editable setting selection to No. - Configuring Field 3 (Output Relay Monitor – Bottom Left): Drag a third I/O Box (BOOL)
element block onto the bottom line of the grid, aligning it to the left edge. Set its character
Length parameter to 7, and configure its properties:
• Link the field path directly to your registeredLedStatusvariable tag.
• Set the True Text string to ON and the False Text string to OFF.
• Set the Text Before label string parameter to exactly"LED ".
• Set the Editable setting parameter toggle to No. - Configuring Field 4 (Soft-Key Control Button – Bottom Right): Drag a final I/O Box (BOOL)
element and arrange it on the bottom line, right next to the LED monitor block. Configure its properties to
enable software-driven field controls:
• Link the field path directly to your registeredNoInputvariable tag.
• Set the True Text to ON and the False Text to OFF.
• Set the Text Before label string parameter to exactly"Btn ".
• CRITICAL DESIGN ADJUSTMENT: Modify the Editable parameter toggle line selection option to read YES. This specific parameter tells the device firmware to accept physical front keypad button inputs to toggle this register value.
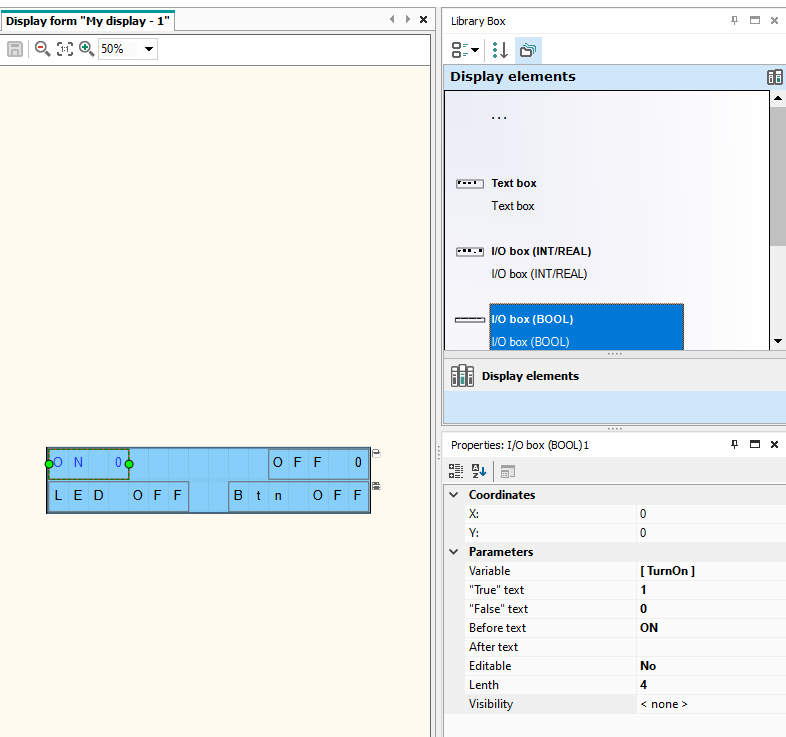
Figure : 4 Placing and mapping Boolean I/O Box display elements onto the 16-character split text row grid coordinates.
🚀 Step 4: Hardware Code Transfer & Multi-Screen Keypad Navigation Mechanics
Reconnect your physical test bench wiring setup using the exact parameters verified in Lesson 2, and transfer your compiled program down into the PR200 core memory registers using the Ctrl + F7 developer shortcut command string.
Live Diagnostics Verification: Pressing your physical wiring switches connected to
I1 and I2 will operate the internal hardware circuits exactly as before. However, you
can now run real-time diagnostics directly on the device faceplate. The top line updates instantly, tracing the
binary 0 or 1 edge transitions of your physical control station loops right as you click them.
Testing the Keypad Soft Override: To trigger the output relay programmatically without
activating any physical inputs, click the front panel SEL (Select) button on the face of the
PR200. Your editable display field string text—reading "Btn OFF"—will begin blinking rapidly to
indicate active selection focus. Press the hardware UP Arrow button on the unit to force the
register parameter value to ON (or click the DOWN Arrow button to return it
back to OFF). Once you hit the high state string, click the OK button to apply the change
entry. The internal mechanical relay contacts will instantly click closed, lighting up your physical workbench
diagnostic LED!
🔍 Operational Troubleshooting
If pressing the SEL button makes an alternate data text block blink instead of your target field, re-verify your object settings inside the properties dashboard panel and confirm that all alternate non-control field boxes have their Editable property parameter explicitly locked to No. Physical hardware input states are immutable data rows; they cannot be forced or overwritten by soft-key configurations.
Advanced Multi-Row Navigation and Value Editing: While our initial form maps directly onto a fixed 2-line layout space, the PR200 display driver engine can host multiple layout rows within a single form. Users can navigate through these additional text layers by using the front panel UP and DOWN arrow keys to scroll. When modifying heavy numeric variables (such as counter configurations or timer durations) across these menus, follow these professional keypad navigation shortcuts:
- Rapid Scrolling Values: Keep the UP or DOWN arrow key pressed continuously to rapidly accelerate values upward or downward without needing individual key presses.
- Precise Decimal Adjustments: To edit complex decimal numbers (like a value of
1.20) without scrolling through hundreds of digits, click the SEL key once to enter editing mode. Keep the front panel ALT key pressed down and click the LEFT Arrow button three times to shift your input cursor to the left, highlighting the exact decimal column you want to change. To shift back right, hold ALT and click the RIGHT Arrow button. Click OK to confirm your changes, or tap ESC to cancel. - Entering Core System Settings: Keep the front panel ALT key pressed down for several seconds without pressing any arrow buttons to enter the built-in system parameters menu. To exit this screen and return to your custom logic form, keep the ESC key pressed down for a few seconds. Reviewing the official hardware operations manual is highly recommended to take full advantage of these built-in system configurations.
⚠️ The Simulator Blindspot
A crucial characteristic to keep in mind when working with current versions of the akYtec ALP programming framework is that the offline simulator engine can validate your FBD logic blocks, but it cannot render a virtual preview of the LCD text rows. To verify your text alignments, layout groupings, and variable strings, you must transfer your project file straight onto an active physical device core.
By configuring variable blocks, mapping text slots, and using keypad overrides to drive physical outputs, you have successfully met the target engineering milestones of this lesson. Take some time to experiment with alternative text strings, explore character padding, and check out the extensive inventory of open-source plugins, code examples, and shared system macros available within the global akYtec integration developer community to accelerate your learning path.
Ready to Master Time-Based Industrial Sequencing?
You have successfully structured character grids, configured variable data logs, and mastered front-panel keypad overrides on physical silicon. Now, let’s step up to managing time-delay events.